
The cryptocurrency market is a landscape of dizzying volatility, where fortunes can be made or lost in minutes. At the heart of this chaos lies a perennial challenge for every trader: distinguishing between a genuine market shift and a deceptive trap. Is that sudden surge a sustainable breakout, or just a fakeout designed to shake out the weak hands?
Learning to differentiate between these two is arguably the most important skill in trading. As one trading veteran noted, “More money is lost on fakeouts than on any other pattern”. This is because fakeouts prey on human psychology—the fear of missing out (FOMO) and the impulse to chase momentum.
This article will dissect the anatomy of breakouts and fakeouts, revealing the key distinctions. More importantly, we will explore three powerful chart patterns that can help you anticipate major crypto moves and avoid falling victim to market traps.
The Anatomy of a Move: Breakout vs. Fakeout
Before diving into patterns, it’s crucial to understand what these terms mean and how to spot the difference in real-time.
What is a Real Breakout?
A genuine breakout occurs when the price of an asset moves beyond a key level of support or resistance with sufficient conviction. It signals a shift in the supply and demand balance, where one side has gained decisive control.
What is a Fakeout (or False Breakout)?
A fakeout is a deceptive price movement where the price briefly pierces a key level, triggering stop-losses and entry orders, only to reverse direction and return to its previous range. These are common traps set by large players to hunt liquidity.
Key Differences: The 4 Pillars of Validation
According to extensive trading analysis, the distinction comes down to four primary factors.
1. Volume: The Fuel Behind the Move
- Real Breakout: A valid breakout is almost always accompanied by a significant increase in trading volume. This “volume spike” indicates broad participation and genuine interest in the new price level.
- Fakeout: A fakeout often occurs on weak or declining volume. The move lacks the “fuel” to sustain itself, suggesting it was driven by a brief burst of speculation rather than real conviction.
2. Price Action & Candlesticks
- Real Breakout: The price breaks the level with a strong, bullish candlestick that has a large body and small wicks, closing cleanly above resistance.
- Fakeout: The breakout is marked by indecision. Look for long wicks (shadows) piercing the level but the price closing back within the old range, or an immediate rejection from the level.
3. Follow-Through & Retest
- Real Breakout: The price continues to move in the breakout direction. Often, the price will pull back to “retest” the broken level, which now acts as new support, and successfully holds it.
- Fakeout: The price reverses quickly, often within the same trading session, failing to hold above the breakout level.
4. Market Context
- Real Breakout: The breakout aligns with the higher timeframe trend (e.g., a breakout in an uptrend is more likely to succeed) or a significant fundamental catalyst.
- Fakeout: It occurs in a choppy, sideways market or against the prevailing trend.
3 Chart Patterns That Predict Major Crypto Moves
While understanding the principles of volume and price action is essential, combining them with specific chart patterns can significantly improve your ability to predict the next major move.
Here are three key patterns that often precede major breakouts or fakeouts.
Pattern 1: The Bull and Bear Trap (The “Liquidity Hunt”)
Bull and bear traps are specific types of fakeouts that are actively engineered by the market. They are perhaps the most critical patterns to recognize for survival in crypto trading.
- Bull Trap: This pattern fakes strength. The price breaks above a resistance level, enticing traders to buy (go long). However, the breakout fails, and the price reverses sharply downward, trapping the new buyers in a losing position.
- Bear Trap: This pattern fakes weakness. The price breaks below a support level, convincing traders to sell (go short). The price then quickly reverses upward, trapping the sellers who must now buy back at a loss.
How to Trade It:
- Avoid Chasing: The primary lesson is to never buy the first breakout or sell the first breakdown.
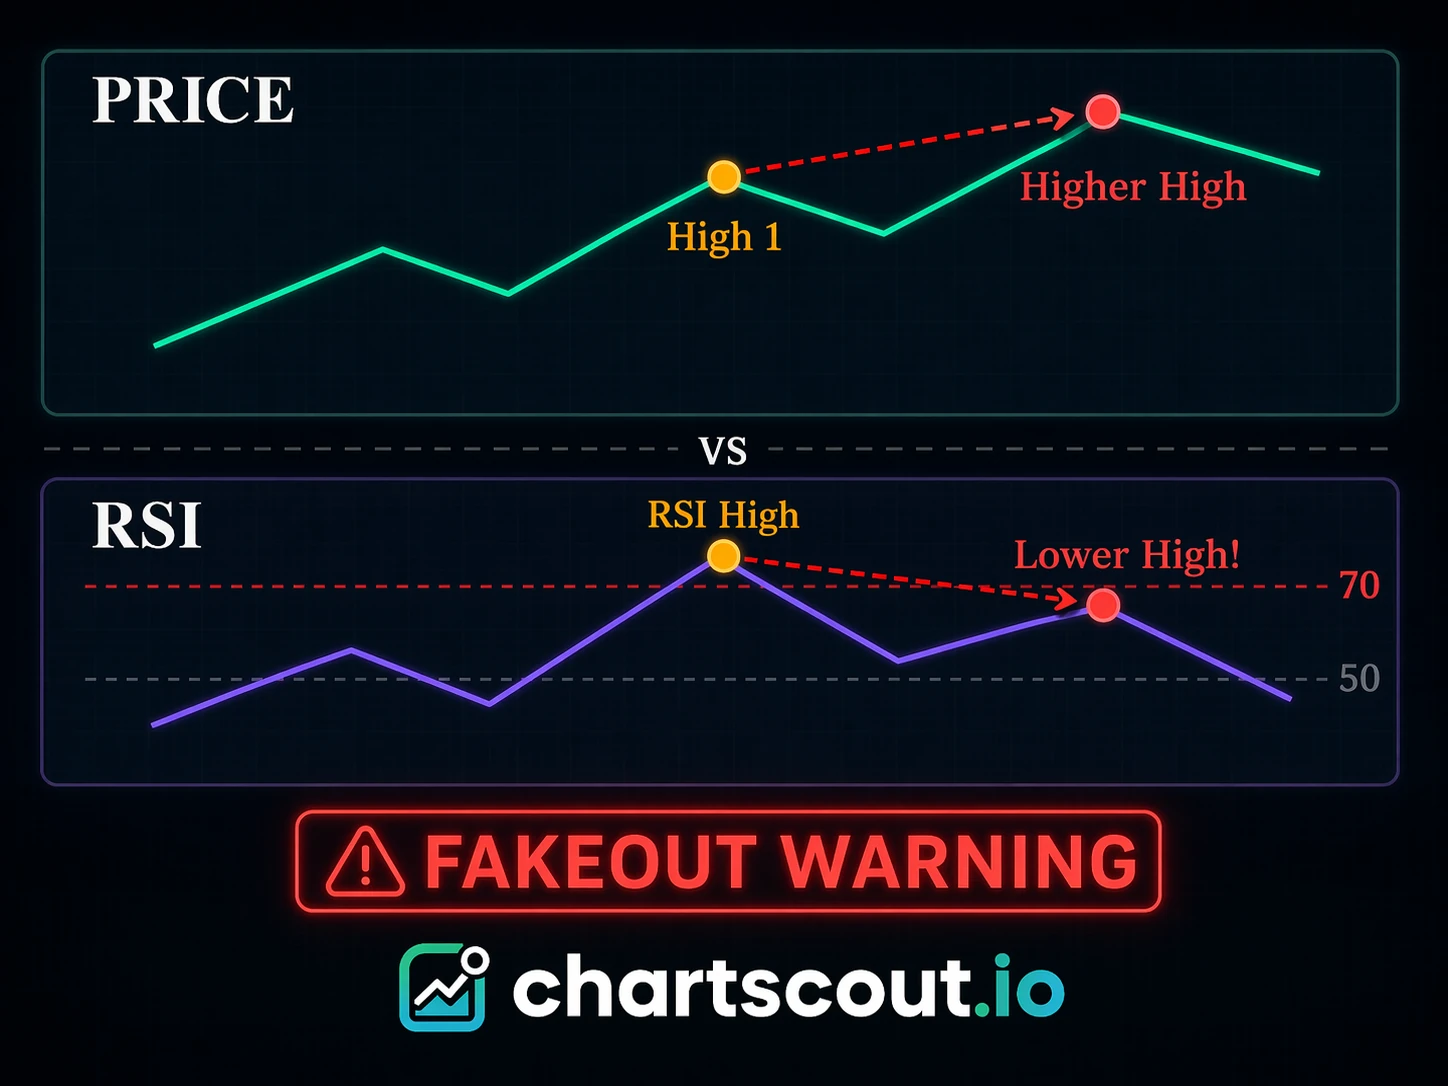
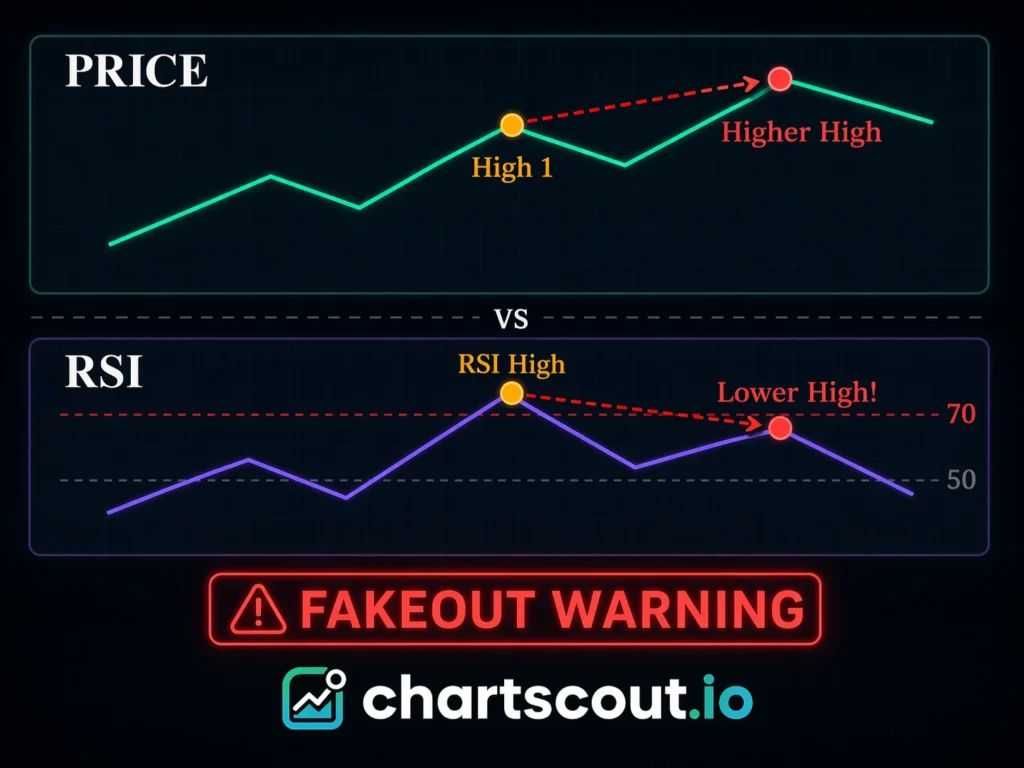
- Look for Divergence: A key indicator of a trap is a divergence between price and momentum indicators like the Relative Strength Index (RSI). For instance, if the price makes a new high but the RSI makes a lower high, it’s a classic warning sign of a weakening trend.
- Wait for Confirmation: Let the market prove itself. Wait for the price to hold the new level as support before entering a trade.
Pattern 2: Consolidation Patterns (Triangles, Flags, and Ranges)
Before a major move, the market often enters a consolidation phase. This is where supply and demand battle it out, and the outcome determines the next trend. Common patterns include triangles, flags, and rectangles.
These patterns provide clear areas for breakouts, but they are also classic setups for fakeouts.
- The Setup: Price is trading within a tightening range (a symmetrical triangle), a flat resistance with rising support (an ascending triangle), or a rectangular zone.
- The Breakout/Fakeout: The price breaks out of this pattern. A “real” breakout is confirmed by a strong close outside the pattern with a spike in volume. A fakeout will see the price spike out of the pattern only to quickly collapse back inside.
How to Trade It:
- Identify the Pattern: Learn to spot these patterns on the chart.
- Set Entry at the Retest: Instead of buying the initial breakout from the pattern, wait for the price to retest the newly broken trendline or support/resistance level. If it holds, that’s a much higher-probability entry point.
Pattern 3: The “Failed Breakout” as a Reversal Signal
This pattern is the ultimate expression of a fakeout turning into a major move. It occurs when the market generates a decisive-looking breakout that is swiftly reversed. This sudden reversal is often the start of a powerful new trend in the opposite direction.
- The Setup: Price appears to break out of a range or a consolidation pattern with a strong bullish or bearish candle. Impatient traders pile in.
- The Fakeout: Within hours or even minutes, the price completely reverses the move, taking out the breakout level.
- The Reversal: This sudden move against the breakout direction becomes a catalyst for a strong trend. It often triggers a cascade of liquidations from over-leveraged traders, accelerating the move.
How to Trade It:
- The “Iceberg” Approach: This pattern is best traded by professional “fade” traders, who intentionally fade (trade against) a weak breakout. This is an advanced strategy. For most traders, the lesson is to use this pattern as a stop-loss trigger. If you are long and the price breaks below the support of the breakout, cut your losses quickly—the market is signaling a reversal.
- Fade the Weak Move: If you see a breakout on very weak volume and a swift rejection, you can consider a “fade” trade (selling a failed bullish breakout or buying a failed bearish breakdown). This is a high-risk, high-reward strategy that requires precise timing.
How to Filter Breakouts for Success
To navigate the crypto market successfully, you need a systematic approach. Here is a simple checklist to filter potential breakout trades, which incorporates the 4 Pillars of Validation with the patterns mentioned above.
- Is there a clear pattern? (Consolidation, triangle, flag, support/resistance)
- Is volume spiking? (A real move needs volume, a fakeout lacks it)
- Is the candle strong? (Look for a close above/below the key level, not just a wick)
- Can it hold the level? (Wait for the retest to confirm the new support/resistance)
- Is there confluence? (Does it align with a higher timeframe trend or a fundamental catalyst?)
Conclusion
The crypto market is a battleground between smart money and retail traders. By understanding the mechanics of breakouts and fakeouts, and by recognizing the chart patterns that precede them, you can dramatically improve your trading results. The key is discipline: avoid impulsive entries, always wait for confirmation, and manage your risk effectively. The market rewards patience, not speed. “Most losses didn’t come from bad analysis, they came from being early”.
FAQ
1. What is the main difference between a breakout and a fakeout?
A breakout is a sustained price movement that continues in the new direction after breaking a key level, often supported by high volume. A fakeout is a deceptive move that breaks a level and then quickly reverses back into the previous range, trapping traders.
2. What chart patterns best signal a major crypto move?
Key patterns include consolidation patterns like triangles and flags, bull and bear traps (which signal fakeouts), and the “failed breakout” pattern (which can signal a powerful reversal). These patterns indicate where the market is accumulating energy before a major price shift.
3. How does trading volume help distinguish a real breakout from a fakeout?
Volume is a leading indicator of conviction. A real breakout is almost always accompanied by a significant spike in trading volume, showing broad market participation. A fakeout typically happens on flat or declining volume, indicating a lack of genuine interest and a higher probability of reversal.
4. What is a “bull trap” in crypto trading?
A bull trap occurs when the price briefly breaks above a resistance level, creating a bullish signal that attracts buyers. The price then reverses and falls sharply, “trapping” those buyers in losing positions. It’s a classic form of a fakeout on the upside.
5. What is the safest trading strategy for a breakout?
The safest strategy is to wait for a retest. Instead of buying the initial breakout candle, wait for the price to pull back and test the old resistance as the new support. If it holds, that is often a high-probability entry point, confirming the breakout is genuine.
6. How can I avoid being caught in a crypto fakeout?
To avoid fakeouts, never act on the first impulse. Use a confirmation checklist: check for a clear chart pattern, a spike in volume, a strong candlestick close, and a successful retest of the level. Also, ensure the move aligns with the higher time frame trend or a fundamental catalyst.